|
 |
||
 |
| Home | Site Map | Organization |
|
Temporal Distributions
| |||||||||||||||||||||||||||||||||||||||||||||||||||||||||||||||
Temporal distributions of precipitation amounts exceeding precipitation frequency estimates for the 2-year average recurrence interval are provided for 6-, 12-, 24-, and 96-hour durations. The temporal distributions are expressed in probability terms as cumulative percentages of precipitation totals at various time steps. To provide detailed information on the varying temporal distributions, separate temporal distributions were also derived for four precipitation cases defined by the duration quartile in which the greatest percentage of the total precipitation occurred. Unique temporal distributions were derived for each temporal distribution area, which were delineated based on selected extreme precipitation characteristics (see documentation for more details). | |
DOWNLOAD TEMPORAL DISTRIBUTIONS: | |
| Temporal distributions for 6-, 12-, 24- and 96-hour durations can be downloaded as comma-delimited files for each temporal distribution area: Volume |
|
|
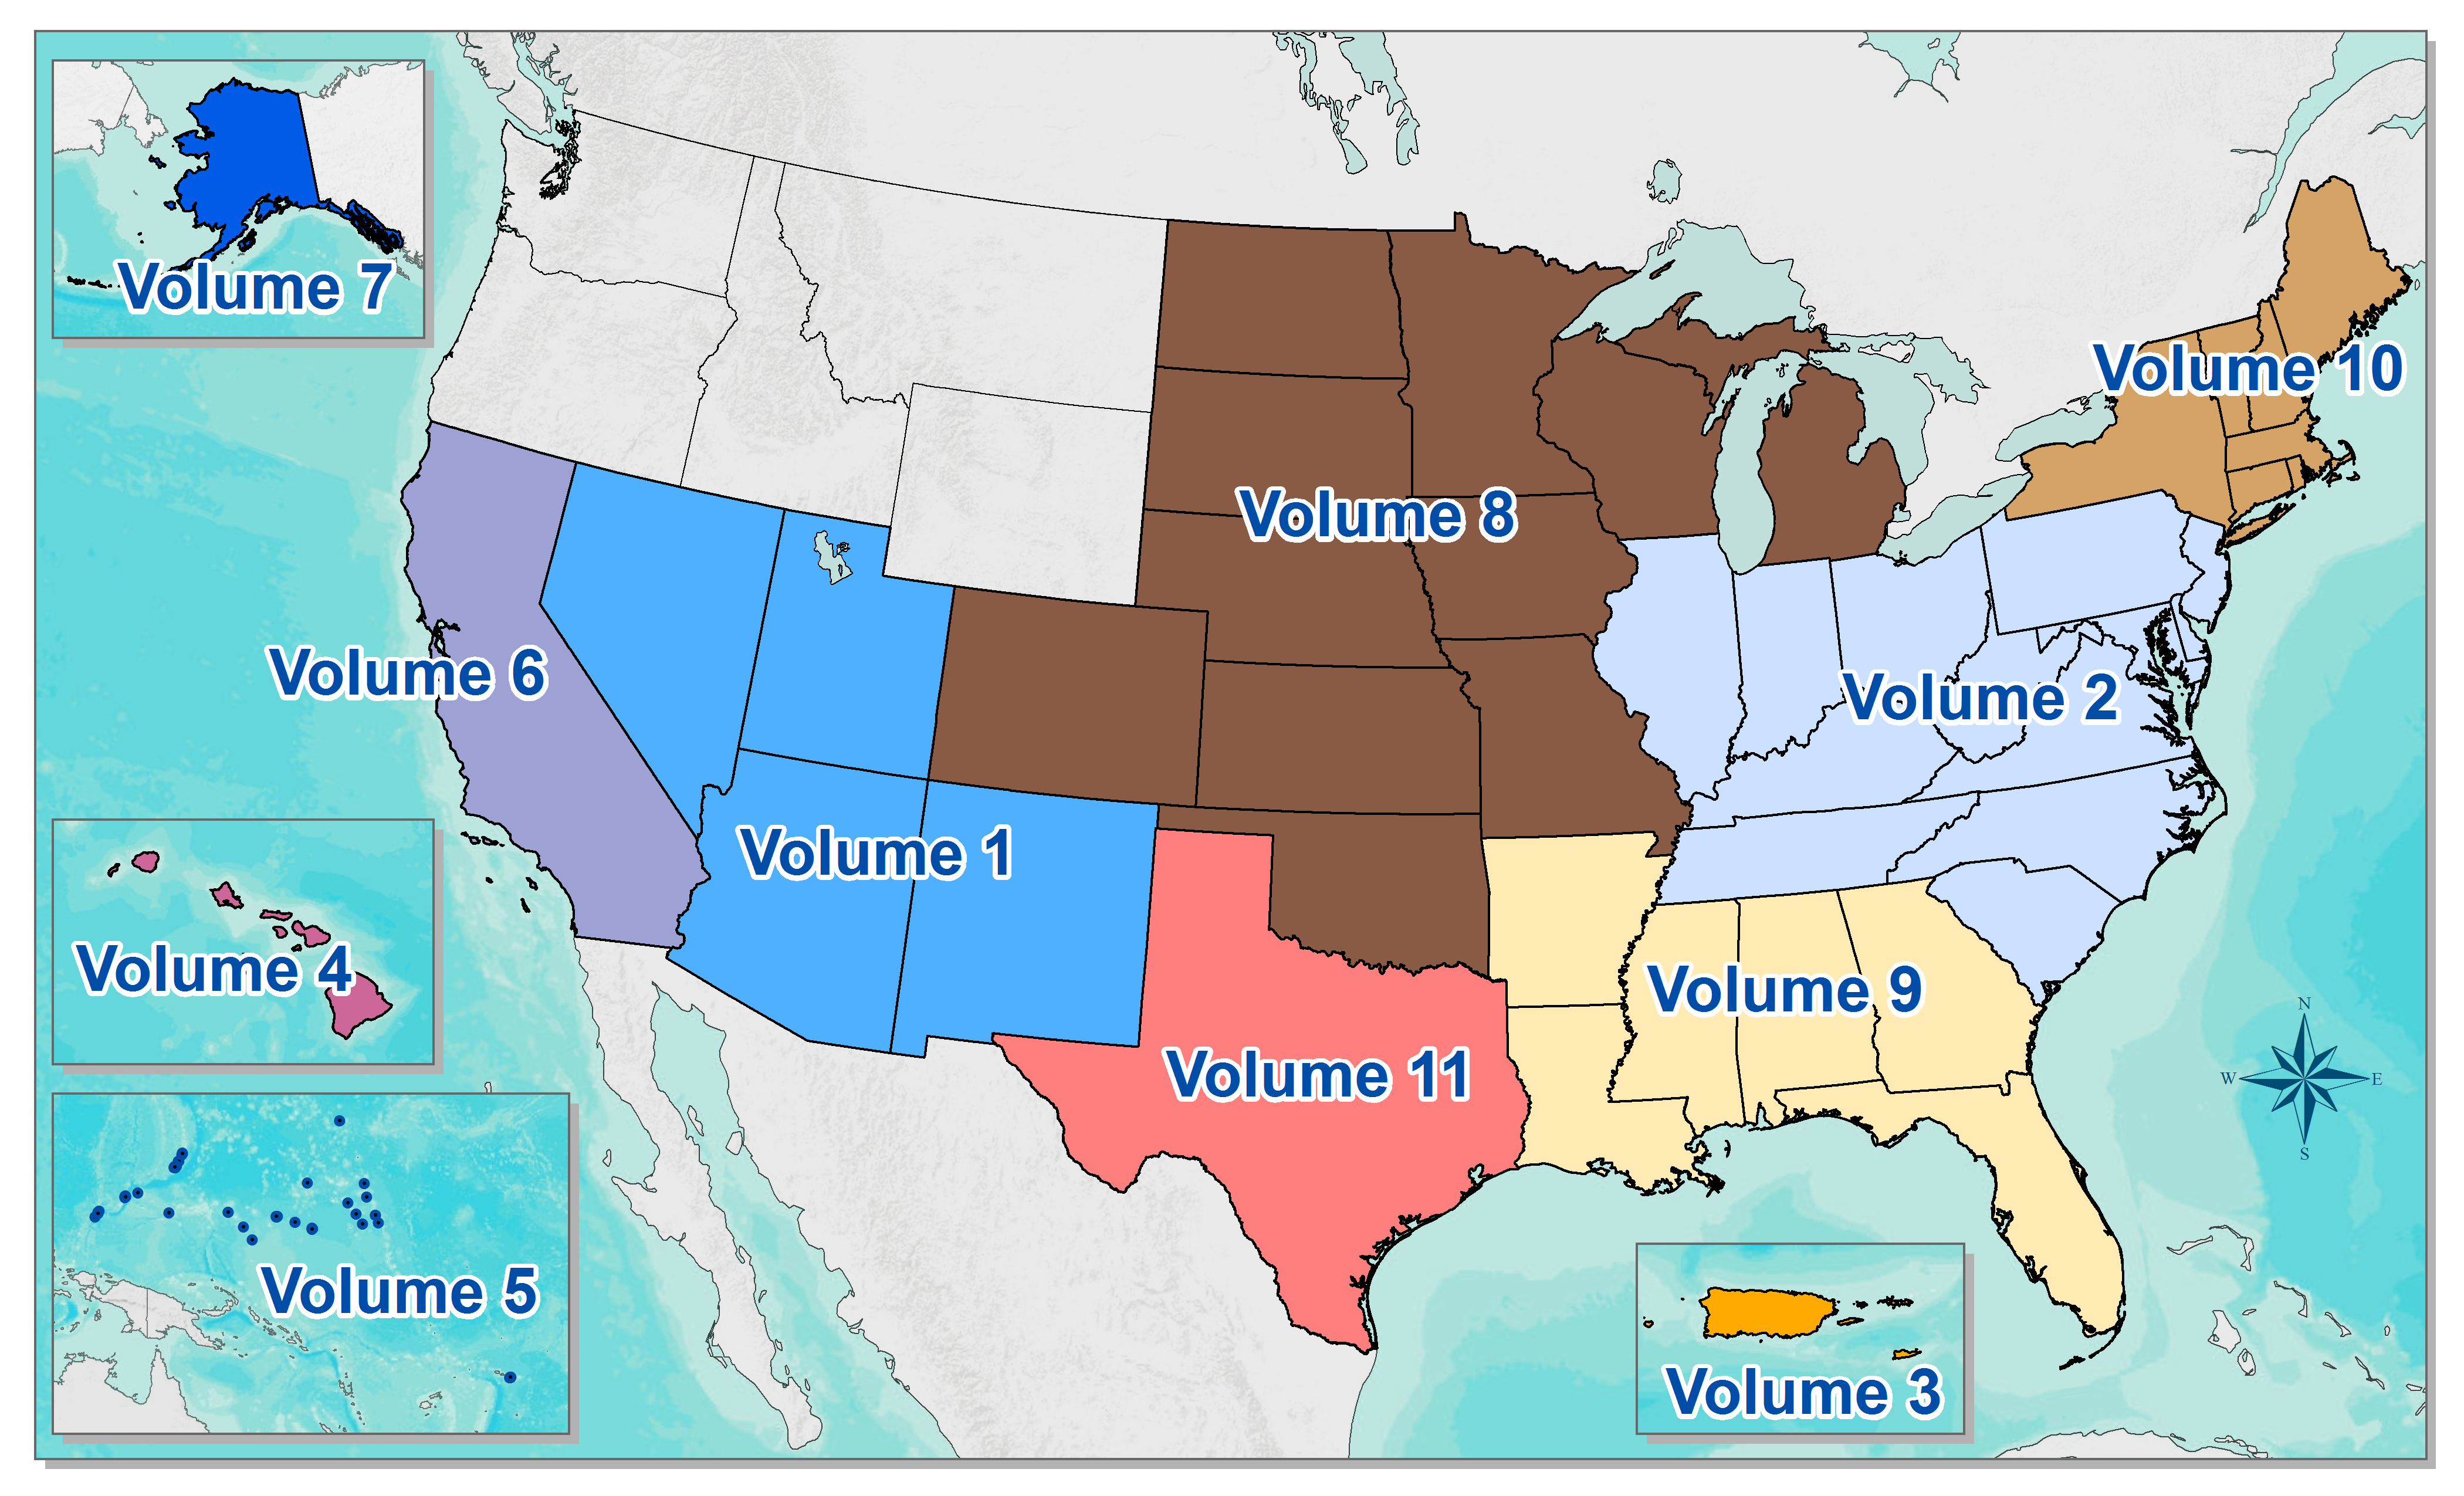
Temporal distribution area (see map above):
Temporal distribution area (see map above):
Temporal distribution area (see map above):
Temporal distribution area (see map above):
Temporal distribution area (see map above):
Temporal distribution area (see map above):
Temporal distribution area (see map above):
Temporal distribution area (see map above):
Temporal distribution area (see map above):
Temporal distribution area (see map above):
Temporal distribution area (see map above):
Temporal distribution area (see map above):
| |
| Duration: | |
DOWNLOAD SHAPEFILES FOR TEMPORAL DISTRIBUTION AREAS: | |
| Shapefiles for temporal distribution areas for each Volume, except for Volume 5: Selected Pacific Islands, are available for download via following links: | |
|
Volume 1: Semiarid Southwest Volume 2: Ohio River Basin and Surrounding States Volume 3: Puerto Rico and the U.S. Virgin Islands Volume 4: Hawaiian Islands Volume 5: Selected Pacific Islands (shapefiles not available) Volume 6: California Volume 7: Alaska Volume 8: Midwestern States Volume 9: Southeastern States Volume 10: Northeastern States Volume 11: Texas Volume 12: Interior Northwest |
| Note: Temporary disruptions may occur Wednesdays from 4-7 pm ET during routine maintenance. |
| Main Link Categories: Home | OWP |
| US Department of Commerce National Oceanic and Atmospheric Administration National Weather Service Office of Water Prediction (OWP) 1325 East West Highway Silver Spring, MD 20910 Page Author: HDSC webmaster Page last modified: November 10th, 2022 |
Disclaimer Credits Glossary |
Privacy Policy About Us Career Opportunities |