Contents
- Start Fresh
- Query data at a single Latitude/Longitude
- Start with some basic input information
- Display some general information about the OPeNDAP dataset
- Get information about the variables / attributes in the OPeNDAP dataset
- Now query the axes data (lat, lon, ari)
- Subset the precipitation frequency data
- Plot the data
Start Fresh
clear
close('all')
clc
Query data at a single Latitude/Longitude
This script reads an OPeNDAP dataset and returns precipitation frequency estimates for all durations and average recurrence intervals for a specific latitude / longitude pair.
Start with some basic input information
Save the URL string into a MATLAB string variable
opendap_url = 'https://hdsc.nws.noaa.gov/thredds/dodsC/data/NOAA_Atlas_14_CONUS.nc';
Give the location's station ID for plot labeling purposes
Id = '01-8380';
Give a Latitude / Longitude
Latitude = 33.2119;
Longitude = -87.6161;
Display some general information about the OPeNDAP dataset
ncdisp(opendap_url)
Source:
           https://hdsc.nws.noaa.gov/thredds/dodsC/data/NOAA_Atlas_14_CONUS.nc
Format:
           classic
Global Attributes:
           history     = 'Version 1.0'
           summary     = 'HDSC Precipitation Frequency Data, http://hdsc.nws.noaa.gov/hdsc/pfds/'
           source      = 'NOAA/NWS/OWP/HDSC'
           contact     = 'email:HDSC.Questions@noaa.gov'
           Conventions = 'CF-1.6'
           title       = 'HDSC PFDS'
Dimensions:
           ari = 9
           lat = 3121
           lon = 7081
Variables:
    lat
           Size:       3121x1
           Dimensions: lat
           Datatype:   single
           Attributes:
                       axis        = 'Y'
                       units       = 'degrees_north'
                       long_name   = 'Latitude'
                       _ChunkSizes = 3121
    lon
           Size:       7081x1
           Dimensions: lon
           Datatype:   single
           Attributes:
                       axis        = 'X'
                       units       = 'degrees_east'
                       long_name   = 'Longitude'
                       _ChunkSizes = 7081
    ari
           Size:       9x1
           Dimensions: ari
           Datatype:   single
           Attributes:
                       units               = 'years'
                       axis                = 'Z'
                       _CoordinateAxisType = 'GeoZ'
                       long_name           = 'Average Recurrence Interval'
                       _ChunkSizes         = 9
    pf_001_hr
           Size:       9x7081x3121
           Dimensions: ari,lon,lat
           Datatype:   int16
           Attributes:
                       _CoordinateAxes = 'lat lon ari '
                       units           = 'inches'
                       scale_factor    = 0.01
                       long_name       = 'Precipitation_frequency_estimates_001_hour'
                       missing_value   = -9
                       _FillValue      = -9
                       _ChunkSizes     = [49  111    1]
    pf_002_hr
           Size:       9x7081x3121
           Dimensions: ari,lon,lat
           Datatype:   int16
           Attributes:
                       _CoordinateAxes = 'lat lon ari '
                       units           = 'inches'
                       scale_factor    = 0.01
                       long_name       = 'Precipitation_frequency_estimates_002_hour'
                       missing_value   = -9
                       _FillValue      = -9
                       _ChunkSizes     = [49  111    1]
    pf_003_hr
           Size:       9x7081x3121
           Dimensions: ari,lon,lat
           Datatype:   int16
           Attributes:
                       _CoordinateAxes = 'lat lon ari '
                       units           = 'inches'
                       scale_factor    = 0.01
                       long_name       = 'Precipitation_frequency_estimates_003_hour'
                       missing_value   = -9
                       _FillValue      = -9
                       _ChunkSizes     = [49  111    1]
    pf_006_hr
           Size:       9x7081x3121
           Dimensions: ari,lon,lat
           Datatype:   int16
           Attributes:
                       _CoordinateAxes = 'lat lon ari '
                       units           = 'inches'
                       scale_factor    = 0.01
                       long_name       = 'Precipitation_frequency_estimates_006_hour'
                       missing_value   = -9
                       _FillValue      = -9
                       _ChunkSizes     = [49  111    1]
    pf_012_hr
           Size:       9x7081x3121
           Dimensions: ari,lon,lat
           Datatype:   int16
           Attributes:
                       _CoordinateAxes = 'lat lon ari '
                       units           = 'inches'
                       scale_factor    = 0.01
                       long_name       = 'Precipitation_frequency_estimates_012_hour'
                       missing_value   = -9
                       _FillValue      = -9
                       _ChunkSizes     = [49  111    1]
    pf_024_hr
           Size:       9x7081x3121
           Dimensions: ari,lon,lat
           Datatype:   int16
           Attributes:
                       _CoordinateAxes = 'lat lon ari '
                       units           = 'inches'
                       scale_factor    = 0.01
                       long_name       = 'Precipitation_frequency_estimates_024_hour'
                       missing_value   = -9
                       _FillValue      = -9
                       _ChunkSizes     = [49  111    1]
    pf_048_hr
           Size:       9x7081x3121
           Dimensions: ari,lon,lat
           Datatype:   int16
           Attributes:
                       _CoordinateAxes = 'lat lon ari '
                       units           = 'inches'
                       scale_factor    = 0.01
                       long_name       = 'Precipitation_frequency_estimates_048_hour'
                       missing_value   = -9
                       _FillValue      = -9
                       _ChunkSizes     = [49  111    1]
    pf_072_hr
           Size:       9x7081x3121
           Dimensions: ari,lon,lat
           Datatype:   int16
           Attributes:
                       _CoordinateAxes = 'lat lon ari '
                       units           = 'inches'
                       scale_factor    = 0.01
                       long_name       = 'Precipitation_frequency_estimates_072_hour'
                       missing_value   = -9
                       _FillValue      = -9
                       _ChunkSizes     = [49  111    1]
    pf_096_hr
           Size:       9x7081x3121
           Dimensions: ari,lon,lat
           Datatype:   int16
           Attributes:
                       _CoordinateAxes = 'lat lon ari '
                       units           = 'inches'
                       scale_factor    = 0.01
                       long_name       = 'Precipitation_frequency_estimates_096_hour'
                       missing_value   = -9
                       _FillValue      = -9
                       _ChunkSizes     = [49  111    1]
    pf_168_hr
           Size:       9x7081x3121
           Dimensions: ari,lon,lat
           Datatype:   int16
           Attributes:
                       _CoordinateAxes = 'lat lon ari '
                       units           = 'inches'
                       scale_factor    = 0.01
                       long_name       = 'Precipitation_frequency_estimates_168_hour'
                       missing_value   = -9
                       _FillValue      = -9
                       _ChunkSizes     = [49  111    1]
Get information about the variables / attributes in the OPeNDAP dataset
Read the information into a MATLAB variable
opendap_info = ncinfo(opendap_url)
opendap_info =

  struct with fields:

      Filename: 'https://hdsc.nws.noaa.gov/thredds/dodsC/data/NOAA_Atlas_14_CONUS.nc'
          Name: '/'
    Dimensions: [1×3 struct]
     Variables: [1×13 struct]
    Attributes: [1×6 struct]
        Groups: []
        Format: 'classic'
Show the names of the variables available
{opendap_info.Variables.Name}
ans =

  1×13 cell array

  Columns 1 through 5

    {'lat'}    {'lon'}    {'ari'}    {'pf_001_hr'}    {'pf_002_hr'}

  Columns 6 through 9

    {'pf_003_hr'}    {'pf_006_hr'}    {'pf_012_hr'}    {'pf_024_hr'}

  Columns 10 through 13

    {'pf_048_hr'}    {'pf_072_hr'}    {'pf_096_hr'}    {'pf_168_hr'}
Get all the precipitation frequency-related variables
pfVariables = {opendap_info.Variables.Name}';
pfVariables = pfVariables(cellfun(@(s) ~isempty(strfind(s,'pf_')),pfVariables))
pfVariables =

  10×1 cell array

    {'pf_001_hr'}
    {'pf_002_hr'}
    {'pf_003_hr'}
    {'pf_006_hr'}
    {'pf_012_hr'}
    {'pf_024_hr'}
    {'pf_048_hr'}
    {'pf_072_hr'}
    {'pf_096_hr'}
    {'pf_168_hr'}
Now query the axes data (lat, lon, ari)
Read the average recurrence interval into a MATLAB variable
ari = ncread(opendap_url,'ari');
Read the longitudes into a MATLAB variable
lon = ncread(opendap_url,'lon');
Read the latitudes into a MATLAB variable
lat = ncread(opendap_url,'lat');
Create a durations variable from our pfVariables information
dur = [1,2,3,6,12,24,48,72,96,168]';
Subset the precipitation frequency data
Calculate the minimum latitude in the grid
minLat = min(lat)
minLat =

  single

    24
Calculate the minimum longitude in the grid
minLon = min(lon)
minLon =

  single

  -125
Calculate the spacing between grid points.
cellSize = mean(diff(lat))
cellSize =

  single

    0.0083
Find the index for the specific latitude we want
pRow = round((Latitude - minLat)/cellSize) + 1
pRow =

  single

        1106
Find the index for the specific longitude we want
pCol = round((Longitude - minLon)/cellSize) + 1
pCol =

  single

        4487
Read a subset of the precipitation frequency data for our pRow and pCol for all durations and recurrence intervals. The size of the precipitation variable (as seen in the early information queries) is: 9 x 7081 x 3121 (ari x lon x lat). We will loop through the different durations
precip = nan(length(pfVariables),length(ari));
for iDur = 1:length(pfVariables)

    precip(iDur,:) = ncread(opendap_url,pfVariables{iDur},...
        [1 pCol pRow],[length(ari) 1 1],[1 1 1]);


end
Each row above signifies a value for a different duration (dur variable). Each column above signifies a value for a different average recurrence interval (ari variable).
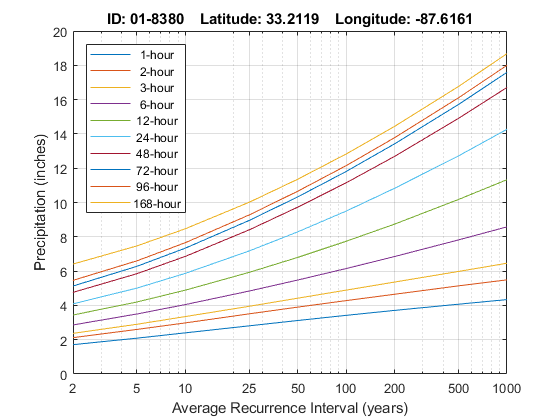
Plot the data
Create a text string version of the "dur" variable. We will use this for our legend in our plot.
durTxt = cellstr(strcat(num2str(dur),'-hour'))
durTxt =

  10×1 cell array

    {'  1-hour'}
    {'  2-hour'}
    {'  3-hour'}
    {'  6-hour'}
    {' 12-hour'}
    {' 24-hour'}
    {' 48-hour'}
    {' 72-hour'}
    {' 96-hour'}
    {'168-hour'}
Execute some MATLAB plotting commands to plot precipitation frequency curves for all average recurrence intervals for all durations at our specific latitude / longitude point.
figure
semilogx(ari,precip)
title(sprintf('ID: %s    Latitude: %.4f    Longitude: %.4f',...
    Id,Latitude,Longitude))
xlabel('Average Recurrence Interval (years)')
ylabel('Precipitation (inches)')
grid on
xlim([2,1000])
legend(durTxt,'Location','northwest')

h = gca;
h.XTick = [2,5,10,25,50,100,200,500,1000];
h.XTickLabel = {'2','5','10','25','50','100','200','500','1000'};