Contents
- Start Fresh
- Query data at one duration and return period
- Start with some basic input information
- Display some general information about the OPeNDAP dataset
- Get information about the variables / attributes in the OPeNDAP dataset
- Now query the axes data (lat, lon, ari)
- Subset the precipitation frequency data
- Plot the data
Start Fresh
clear
close('all')
clc
Query data at one duration and return period
This script reads an OPeNDAP dataset and returns precipitation frequency estimates for 24-hour duration, 10-year average recurrence interval for an area designated by a latitude/longitude box.
Start with some basic input information
Save the URL string into a MATLAB string variable
opendap_url = 'https://hdsc.nws.noaa.gov/thredds/dodsC/data/NOAA_Atlas_14_CONUS.nc';
Give an average recurrence interval and duration
selAvgRecInt = 10; % 10-year average recurrence interval
selDuration = 24; % 24-hour duration
Give a Latitude / Longitude bounding box for contour plot
selLatBoxMin = 25; % Minimum latitude for our box
selLatBoxMax = 33; % Maximum latitude for our box
selLonBoxMin = -94; % Minimum longitude for our box
selLonBoxMax = -79.5; % Maximum longitude for our box
Display some general information about the OPeNDAP dataset
ncdisp(opendap_url)
Source:
           https://hdsc.nws.noaa.gov/thredds/dodsC/data/NOAA_Atlas_14_CONUS.nc
Format:
           classic
Global Attributes:
           history     = 'Version 1.0'
           summary     = 'HDSC Precipitation Frequency Data, http://hdsc.nws.noaa.gov/hdsc/pfds/'
           source      = 'NOAA/NWS/OWP/HDSC'
           contact     = 'email:HDSC.Questions@noaa.gov'
           Conventions = 'CF-1.6'
           title       = 'HDSC PFDS'
Dimensions:
           ari = 9
           lat = 3121
           lon = 7081
Variables:
    lat
           Size:       3121x1
           Dimensions: lat
           Datatype:   single
           Attributes:
                       axis        = 'Y'
                       units       = 'degrees_north'
                       long_name   = 'Latitude'
                       _ChunkSizes = 3121
    lon
           Size:       7081x1
           Dimensions: lon
           Datatype:   single
           Attributes:
                       axis        = 'X'
                       units       = 'degrees_east'
                       long_name   = 'Longitude'
                       _ChunkSizes = 7081
    ari
           Size:       9x1
           Dimensions: ari
           Datatype:   single
           Attributes:
                       units               = 'years'
                       axis                = 'Z'
                       _CoordinateAxisType = 'GeoZ'
                       long_name           = 'Average Recurrence Interval'
                       _ChunkSizes         = 9
    pf_001_hr
           Size:       9x7081x3121
           Dimensions: ari,lon,lat
           Datatype:   int16
           Attributes:
                       _CoordinateAxes = 'lat lon ari '
                       units           = 'inches'
                       scale_factor    = 0.01
                       long_name       = 'Precipitation_frequency_estimates_001_hour'
                       missing_value   = -9
                       _FillValue      = -9
                       _ChunkSizes     = [49  111    1]
    pf_002_hr
           Size:       9x7081x3121
           Dimensions: ari,lon,lat
           Datatype:   int16
           Attributes:
                       _CoordinateAxes = 'lat lon ari '
                       units           = 'inches'
                       scale_factor    = 0.01
                       long_name       = 'Precipitation_frequency_estimates_002_hour'
                       missing_value   = -9
                       _FillValue      = -9
                       _ChunkSizes     = [49  111    1]
    pf_003_hr
           Size:       9x7081x3121
           Dimensions: ari,lon,lat
           Datatype:   int16
           Attributes:
                       _CoordinateAxes = 'lat lon ari '
                       units           = 'inches'
                       scale_factor    = 0.01
                       long_name       = 'Precipitation_frequency_estimates_003_hour'
                       missing_value   = -9
                       _FillValue      = -9
                       _ChunkSizes     = [49  111    1]
    pf_006_hr
           Size:       9x7081x3121
           Dimensions: ari,lon,lat
           Datatype:   int16
           Attributes:
                       _CoordinateAxes = 'lat lon ari '
                       units           = 'inches'
                       scale_factor    = 0.01
                       long_name       = 'Precipitation_frequency_estimates_006_hour'
                       missing_value   = -9
                       _FillValue      = -9
                       _ChunkSizes     = [49  111    1]
    pf_012_hr
           Size:       9x7081x3121
           Dimensions: ari,lon,lat
           Datatype:   int16
           Attributes:
                       _CoordinateAxes = 'lat lon ari '
                       units           = 'inches'
                       scale_factor    = 0.01
                       long_name       = 'Precipitation_frequency_estimates_012_hour'
                       missing_value   = -9
                       _FillValue      = -9
                       _ChunkSizes     = [49  111    1]
    pf_024_hr
           Size:       9x7081x3121
           Dimensions: ari,lon,lat
           Datatype:   int16
           Attributes:
                       _CoordinateAxes = 'lat lon ari '
                       units           = 'inches'
                       scale_factor    = 0.01
                       long_name       = 'Precipitation_frequency_estimates_024_hour'
                       missing_value   = -9
                       _FillValue      = -9
                       _ChunkSizes     = [49  111    1]
    pf_048_hr
           Size:       9x7081x3121
           Dimensions: ari,lon,lat
           Datatype:   int16
           Attributes:
                       _CoordinateAxes = 'lat lon ari '
                       units           = 'inches'
                       scale_factor    = 0.01
                       long_name       = 'Precipitation_frequency_estimates_048_hour'
                       missing_value   = -9
                       _FillValue      = -9
                       _ChunkSizes     = [49  111    1]
    pf_072_hr
           Size:       9x7081x3121
           Dimensions: ari,lon,lat
           Datatype:   int16
           Attributes:
                       _CoordinateAxes = 'lat lon ari '
                       units           = 'inches'
                       scale_factor    = 0.01
                       long_name       = 'Precipitation_frequency_estimates_072_hour'
                       missing_value   = -9
                       _FillValue      = -9
                       _ChunkSizes     = [49  111    1]
    pf_096_hr
           Size:       9x7081x3121
           Dimensions: ari,lon,lat
           Datatype:   int16
           Attributes:
                       _CoordinateAxes = 'lat lon ari '
                       units           = 'inches'
                       scale_factor    = 0.01
                       long_name       = 'Precipitation_frequency_estimates_096_hour'
                       missing_value   = -9
                       _FillValue      = -9
                       _ChunkSizes     = [49  111    1]
    pf_168_hr
           Size:       9x7081x3121
           Dimensions: ari,lon,lat
           Datatype:   int16
           Attributes:
                       _CoordinateAxes = 'lat lon ari '
                       units           = 'inches'
                       scale_factor    = 0.01
                       long_name       = 'Precipitation_frequency_estimates_168_hour'
                       missing_value   = -9
                       _FillValue      = -9
                       _ChunkSizes     = [49  111    1]
Get information about the variables / attributes in the OPeNDAP dataset
Read the information into a MATLAB variable
opendap_info = ncinfo(opendap_url)
opendap_info =

  struct with fields:

      Filename: 'https://hdsc.nws.noaa.gov/thredds/dodsC/data/NOAA_Atlas_14_CONUS.nc'
          Name: '/'
    Dimensions: [1×3 struct]
     Variables: [1×13 struct]
    Attributes: [1×6 struct]
        Groups: []
        Format: 'classic'
Show the names of the variables available
{opendap_info.Variables.Name}
ans =

  1×13 cell array

  Columns 1 through 5

    {'lat'}    {'lon'}    {'ari'}    {'pf_001_hr'}    {'pf_002_hr'}

  Columns 6 through 9

    {'pf_003_hr'}    {'pf_006_hr'}    {'pf_012_hr'}    {'pf_024_hr'}

  Columns 10 through 13

    {'pf_048_hr'}    {'pf_072_hr'}    {'pf_096_hr'}    {'pf_168_hr'}
Now query the axes data (lat, lon, ari)
Read the average recurrence interval into a MATLAB variable
ari = ncread(opendap_url,'ari');
Read the longitudes into a MATLAB variable
lon = ncread(opendap_url,'lon');
Read the latitudes into a MATLAB variable
lat = ncread(opendap_url,'lat');
Subset the precipitation frequency data
Calculate the minimum latitude in the grid
minLat = min(lat)
minLat =

  single

    24
Calculate the minimum longitude in the grid
minLon = min(lon)
minLon =

  single

  -125
Calculate the spacing between grid points.
cellSize = mean(diff(lat))
cellSize =

  single

    0.0083
Find the index for the specific minimum latitude we want
pRowMin = round((selLatBoxMin - minLat)/cellSize) + 1
pRowMin =

  single

   121
Find the index for the specific maximum latitude we want
pRowMax = round((selLatBoxMax - minLat)/cellSize) + 1
pRowMax =

  single

        1081
Find the index for the specific minimum longitude we want
pColMin = round((selLonBoxMin - minLon)/cellSize) + 1
pColMin =

  single

        3721
Find the index for the specific maximum longitude we want
pColMax = round((selLonBoxMax - minLon)/cellSize) + 1
pColMax =

  single

        5461
Find the index for the average recurrence interval we want
pAri = find(ari == selAvgRecInt)
pAri =

     3
Read a subset of the precipitation frequency data for our pRow and pCol for one recurrence interval. The size of the precipitation variable (as seen in the early information queries) is:
9 x 7081 x 3121 (ari x lon x lat).
We only want to look at 24-hour precipitation frequency estimates in this case, or the pf_024_hr variable.
precip = ncread(opendap_url,'pf_024_hr',...
    [pAri pColMin pRowMin],[1 length(pColMin:pColMax) length(pRowMin:pRowMax)],[1 1 1]);
The size of the precipitation frequency data we just read into MATLAB
size(precip)
ans =

           1        1741         961
Let's get rid of the singleton dimension (ari) in our grid. Also rearrange the precipitation matrix so that the row (latitude) is the first dimension, col (latitude) is the 2nd dimension, etc. The ari dimension will disappear since it is a singleton dimension (we chose 1 specific ari).
precip = permute(precip,[3 2 1]);
% The new size of the precipitation frequency data
size(precip)
ans =

         961        1741
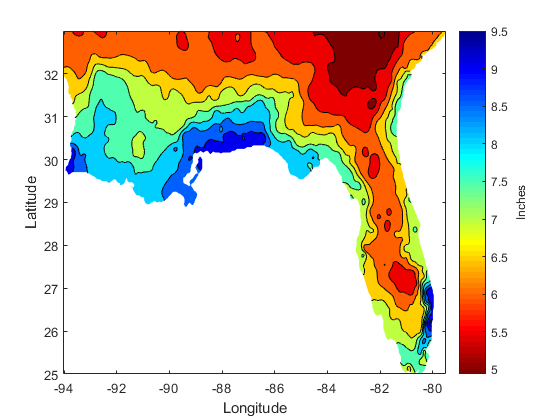
Plot the data
Create a text string for the duration
durTxt = sprintf('%d-hour',selDuration);
Execute some MATLAB plotting commands to plot precipitation frequency curves for all average recurrence intervals for all durations at our specific latitude / longitude point.
f = figure;
[lon_grid,lat_grid] = meshgrid(lon(pColMin:pColMax),lat(pRowMin:pRowMax));
colormap(flipud(colormap('jet')));
contourf(lon_grid,lat_grid,precip);
h = gca;
h.XLabel.String = 'Longitude';
h.YLabel.String = 'Latitude';
c = colorbar;
c.YLabel.String = 'Inches';